import pandas as pdReading in data: Youth Tobacco Survey
Reading in data
Peter Ralph
https://uodsci.github.io/ds435
Set-up:
The National Youth Tobacco Survey
The NYTS is a CDC-funded national survey running since 1999 to assess youth rates of tobacco usage.
Datasets, by year, are currently available on this page.
We’re going to look at the 1999 version. Go read the documentation.
Download
We’ve got the option to download an MS Access or SAS file. We’ll use the SAS version. Get the files:
mkdir -p data
wget -P data https://www.cdc.gov/tobacco/data_statistics/surveys/nyts/zip_files/1999_Codebook_Dataset_SAS.zip
unzip -d data data/1999_Codebook_Dataset_SAS.zip
and then read the PDF. (5-minute reading interlude)
orig_yts = pd.read_sas("data/nyts1999public.sas7bdat").convert_dtypes()
orig_yts| STUDNTID | QN2 | QN3 | QN4A | QN4B | QN4C | QN4D | QN4E | QN4F | QN5 | ... | QN70 | QN71 | QN72 | QN1 | QN16 | WT | PSU2 | STRATUM2 | RACE | YEAR | |
|---|---|---|---|---|---|---|---|---|---|---|---|---|---|---|---|---|---|---|---|---|---|
| 0 | b'0000001' | 1 | 4 | <NA> | <NA> | <NA> | <NA> | <NA> | 1 | 6 | ... | 2 | 1 | 1 | 8 | 1 | 1.18729 | 12085 | 110 | 1 | 1999 |
| 1 | b'0000002' | 2 | 5 | 1 | <NA> | <NA> | <NA> | <NA> | 1 | 6 | ... | 2 | 6 | 6 | 8 | 8 | 1.143755 | 12085 | 110 | 1 | 1999 |
| 2 | b'0000003' | 2 | 5 | <NA> | <NA> | <NA> | <NA> | <NA> | 1 | 6 | ... | 2 | 4 | 1 | 7 | 7 | 1.143755 | 12085 | 110 | 1 | 1999 |
| 3 | b'0000004' | 2 | 5 | <NA> | <NA> | <NA> | <NA> | <NA> | 1 | 6 | ... | 2 | 5 | 4 | 7 | 2 | 1.143755 | 12085 | 110 | 1 | 1999 |
| 4 | b'0000005' | 1 | 5 | <NA> | <NA> | <NA> | <NA> | <NA> | 1 | 6 | ... | 2 | 6 | 3 | 8 | 1 | 1.143755 | 12085 | 110 | 1 | 1999 |
| ... | ... | ... | ... | ... | ... | ... | ... | ... | ... | ... | ... | ... | ... | ... | ... | ... | ... | ... | ... | ... | ... |
| 15053 | b'0015054' | 2 | 7 | <NA> | 1 | <NA> | <NA> | <NA> | <NA> | 2 | ... | 2 | 4 | 1 | 9 | 9 | 0.704504 | 910061 | 902 | 4 | 1999 |
| 15054 | b'0015055' | 2 | 7 | <NA> | 1 | <NA> | <NA> | <NA> | <NA> | 2 | ... | 2 | 1 | 1 | 9 | 1 | 0.704504 | 910061 | 902 | 4 | 1999 |
| 15055 | b'0015056' | 1 | 7 | <NA> | 1 | <NA> | <NA> | <NA> | <NA> | 2 | ... | 2 | 3 | 1 | 9 | 1 | 0.704504 | 910061 | 902 | 4 | 1999 |
| 15056 | b'0015057' | 1 | 7 | <NA> | 1 | <NA> | <NA> | <NA> | <NA> | 2 | ... | 2 | 1 | 1 | 9 | 1 | 0.704504 | 910061 | 902 | 4 | 1999 |
| 15057 | b'0015058' | 2 | 7 | <NA> | 1 | <NA> | <NA> | <NA> | <NA> | 2 | ... | 2 | 1 | 1 | 9 | 1 | 0.704504 | 910061 | 902 | 4 | 1999 |
15058 rows × 83 columns
Summaries
The data should all be from 1999? Oh, good:
orig_yts.YEAR.value_counts(dropna=True)YEAR
1999 15058
Name: count, dtype: Int64Are the STUDNTID numbers all unique? Oh, good.
orig_yts.STUDNTID.value_counts().max()np.int64(1)What is WT? It’s not weight-in-pounds:
orig_yts.WT.describe()count 15058.0
mean 1.0
std 0.554389
min 0.037618
25% 0.647862
50% 0.889969
75% 1.253308
max 5.51623
Name: WT, dtype: Float64Other questions?
Question 1
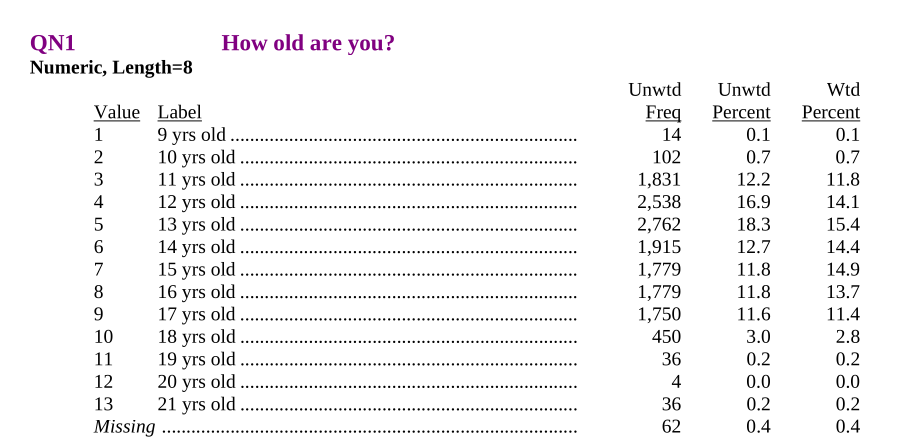
orig_yts.QN1.value_counts(dropna=False)QN1
5 2762
4 2538
6 1915
3 1831
8 1779
7 1779
9 1750
10 450
2 102
<NA> 62
11 36
13 36
1 14
12 4
Name: count, dtype: Int64Let’s recode this
We’ll store all the new variables in a dictionary and make that into a DataFrame at the end (in that order, because pandas).
yts = {}
yts['age'] = orig_yts.QN1 + 8
yts['age'].value_counts(dropna=False)
QN1
13 2762
12 2538
14 1915
11 1831
16 1779
15 1779
17 1750
18 450
10 102
<NA> 62
19 36
21 36
9 14
20 4
Name: count, dtype: Int64Question 3
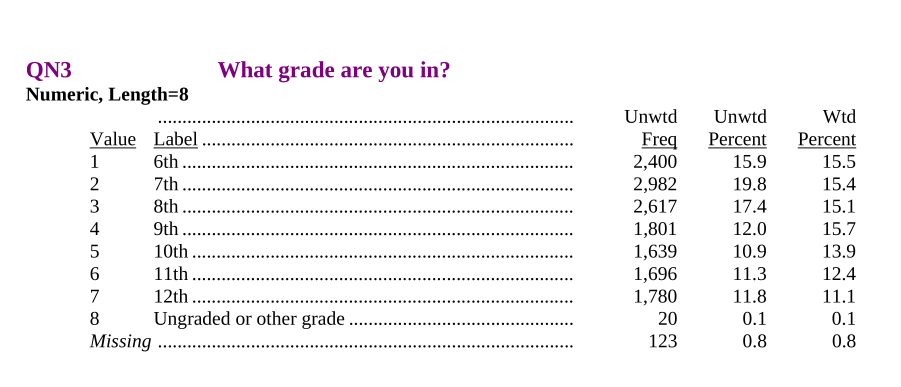
yts['grade'] = orig_yts.QN3 + 5
yts['grade'].value_counts(dropna=False)
QN3
7 2982
8 2617
6 2400
9 1801
12 1780
11 1696
10 1639
<NA> 123
13 20
Name: count, dtype: Int64Consistency checking
pd.crosstab(yts['grade'], yts['age'])| QN1 | 9 | 10 | 11 | 12 | 13 | 14 | 15 | 16 | 17 | 18 | 19 | 20 | 21 |
|---|---|---|---|---|---|---|---|---|---|---|---|---|---|
| QN3 | |||||||||||||
| 6 | 4 | 97 | 1719 | 506 | 56 | 5 | 1 | 0 | 0 | 1 | 0 | 0 | 8 |
| 7 | 2 | 2 | 94 | 1939 | 847 | 82 | 13 | 0 | 1 | 0 | 0 | 0 | 2 |
| 8 | 0 | 1 | 1 | 78 | 1810 | 646 | 69 | 6 | 0 | 0 | 1 | 0 | 3 |
| 9 | 1 | 0 | 2 | 0 | 36 | 1129 | 544 | 71 | 11 | 3 | 0 | 0 | 2 |
| 10 | 0 | 0 | 1 | 0 | 0 | 41 | 1079 | 458 | 53 | 6 | 0 | 0 | 0 |
| 11 | 0 | 0 | 0 | 0 | 0 | 1 | 59 | 1174 | 420 | 34 | 4 | 1 | 3 |
| 12 | 3 | 0 | 0 | 0 | 0 | 0 | 6 | 66 | 1256 | 405 | 31 | 3 | 7 |
| 13 | 3 | 1 | 0 | 0 | 0 | 0 | 1 | 2 | 3 | 0 | 0 | 0 | 10 |
Question 2
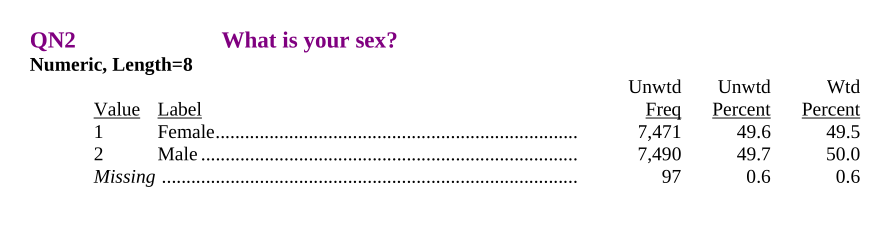
“Missing” can be a useful option for survey questions.
orig_yts.QN2.value_counts(dropna=False)QN2
2 7490
1 7471
<NA> 97
Name: count, dtype: Int64import collections
d = collections.defaultdict(lambda: None,
{ 1 : "F", 2 : "M" }
)
yts['sex'] = pd.Series([d[k] for k in orig_yts.QN2], dtype='string')
yts['sex'].value_counts(dropna=False)M 7490
F 7471
<NA> 97
Name: count, dtype: Int64Question 6
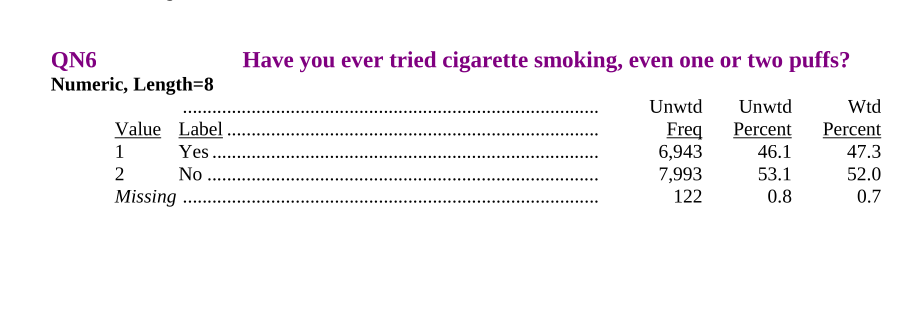
d = collections.defaultdict(lambda: None,
    { 1 : True, 2 : False }
)
yts['ever_smoked'] = pd.Series([d[k] for k in orig_yts.QN6], dtype='boolean')
yts['ever_smoked'].value_counts(dropna=False)
False 7993
True 6943
<NA> 122
Name: count, dtype: Int64Put it together
yts = pd.DataFrame(yts)
yts| age | grade | sex | ever_smoked | |
|---|---|---|---|---|
| 0 | 16 | 9 | F | False |
| 1 | 16 | 10 | M | True |
| 2 | 15 | 10 | M | True |
| 3 | 15 | 10 | M | True |
| 4 | 16 | 10 | F | True |
| ... | ... | ... | ... | ... |
| 15053 | 17 | 12 | M | True |
| 15054 | 17 | 12 | M | False |
| 15055 | 17 | 12 | F | False |
| 15056 | 17 | 12 | F | False |
| 15057 | 17 | 12 | M | True |
15058 rows × 4 columns
Summarize
We want to split-apply-combine. See this list of built-in aggregation methods.
yts.groupby(["grade","sex"]).aggregate(
    prop_smoked = ("ever_smoked", "mean"),
    n = ("ever_smoked", "size")
)| prop_smoked | n | ||
|---|---|---|---|
| grade | sex | ||
| 6 | F | 0.13108 | 1226 |
| M | 0.186632 | 1164 | |
| 7 | F | 0.311315 | 1536 |
| M | 0.337772 | 1434 | |
| 8 | F | 0.436179 | 1280 |
| M | 0.42445 | 1325 | |
| 9 | F | 0.570439 | 869 |
| M | 0.551799 | 926 | |
| 10 | F | 0.607843 | 816 |
| M | 0.632029 | 821 | |
| 11 | F | 0.656827 | 813 |
| M | 0.704598 | 871 | |
| 12 | F | 0.715438 | 870 |
| M | 0.716186 | 903 | |
| 13 | F | 0.923077 | 13 |
| M | 0.666667 | 7 |
Missing Values
What about the missing values?
Question: what does pandas say the “mean” of [True, False, NA] is? (What should it say?)
pd.Series([True, False, pd.NA], dtype="boolean").mean()np.float64(0.5)