The NYTS is a CDC-funded national survey running since 1999 to assess youth rates of tobacco usage.
Datasets, by year, are currently available on this page.
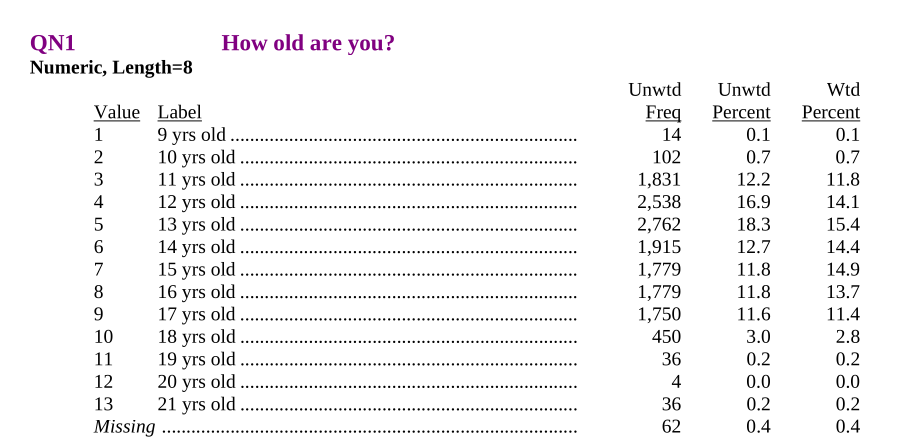
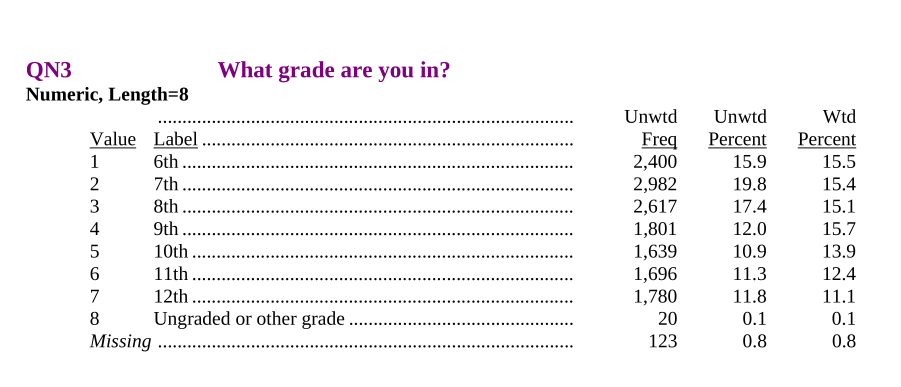
We’re going to look at the 1999 version. Go read the documentation.
Download
We’ve got the option to download an MS Access or SAS file. We’ll use the SAS version. Get the files:
mkdir -p data
wget -P data https://www.cdc.gov/tobacco/data_statistics/surveys/nyts/zip_files/1999_Codebook_Dataset_SAS.zip
unzip -d data data/1999_Codebook_Dataset_SAS.zip
and then read the PDF. (5-minute reading interlude)
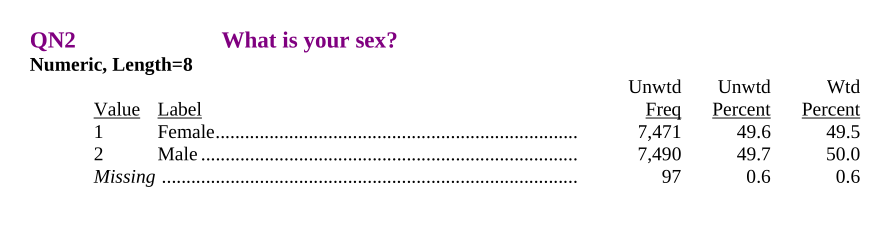
import collectionsd = collections.defaultdict(lambda: None, { 1 : "F", 2 : "M" })yts['sex'] = pd.Series([d[k] for k in orig_yts.QN2], dtype='string')yts['sex'].value_counts(dropna=False)
M       7490
F       7471
<NA>      97
Name: count, dtype: Int64
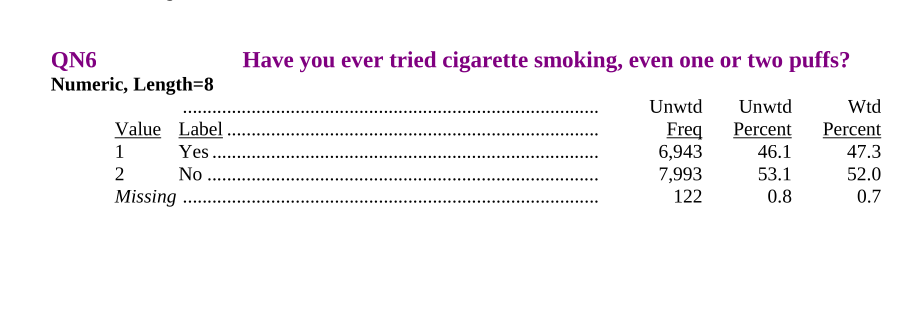
Question 6
d = collections.defaultdict(lambda: None, { 1 : True, 2 : False })yts['ever_smoked'] = pd.Series([d[k] for k in orig_yts.QN6], dtype='boolean')yts['ever_smoked'].value_counts(dropna=False)