Galaxies
2026-03-09
Data
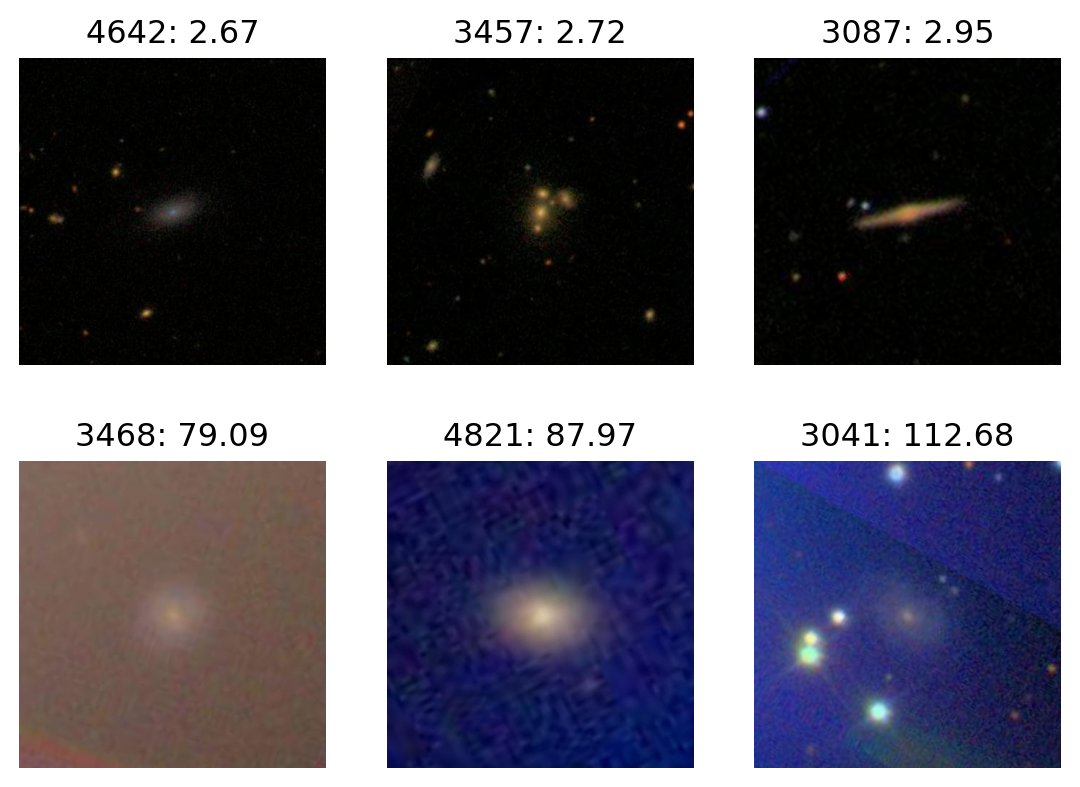
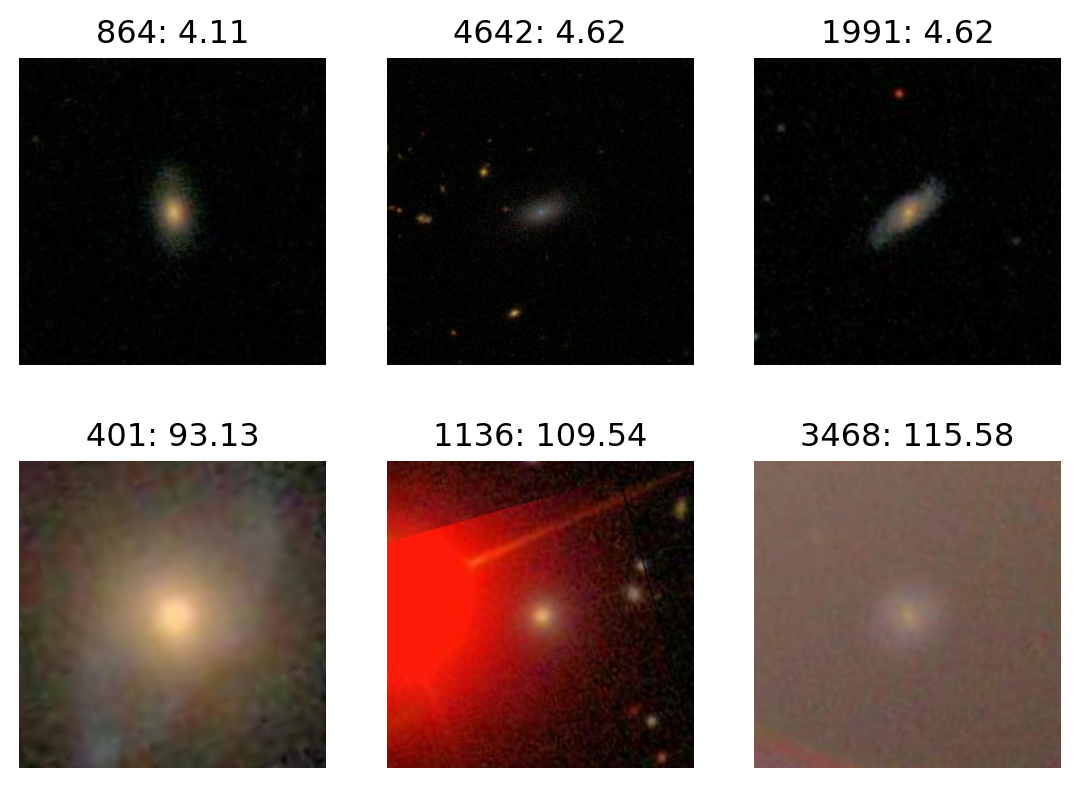
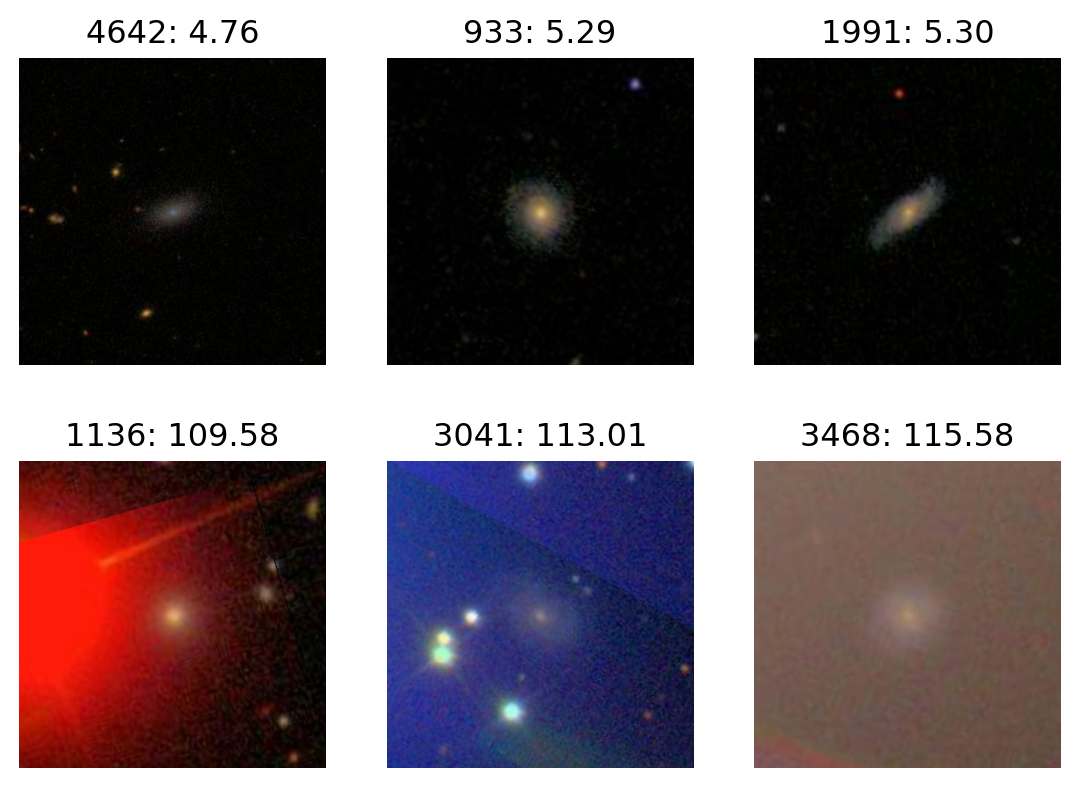
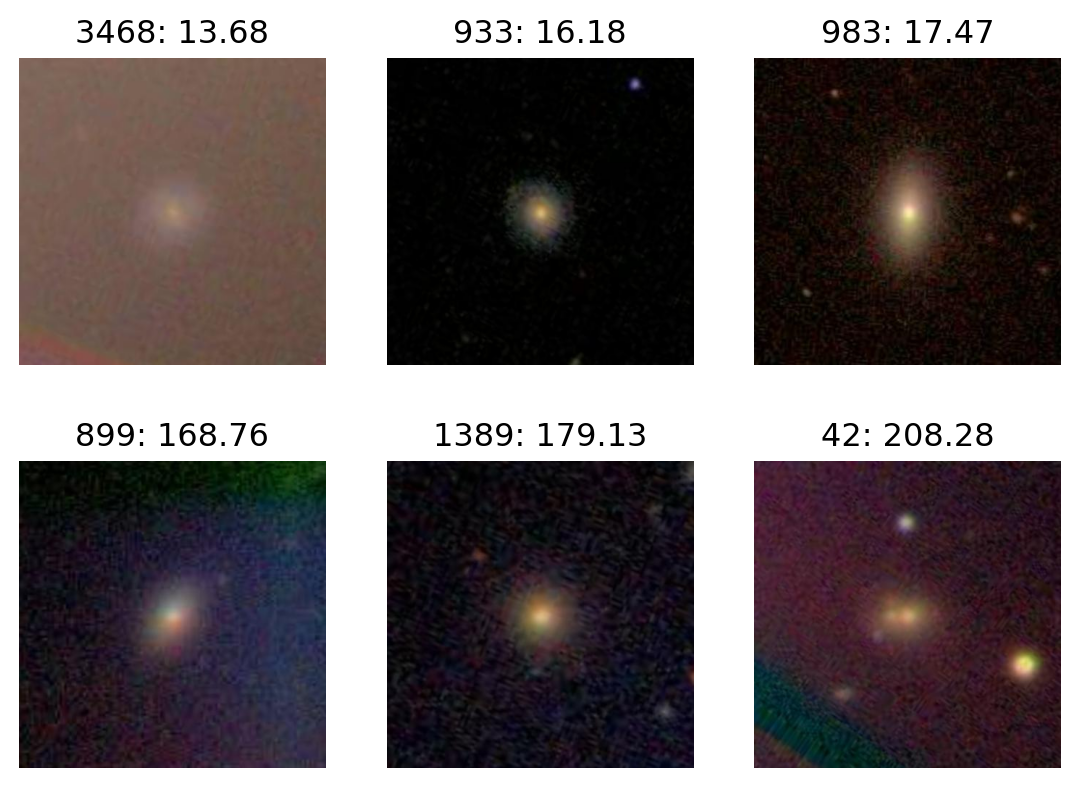
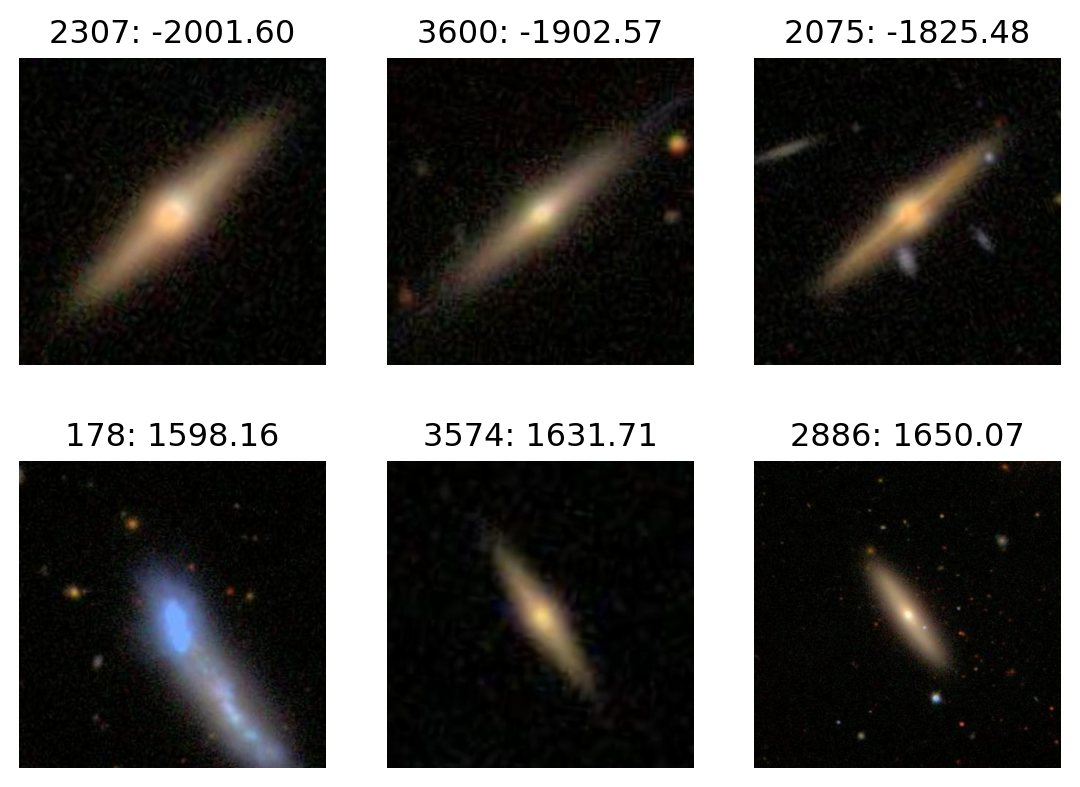
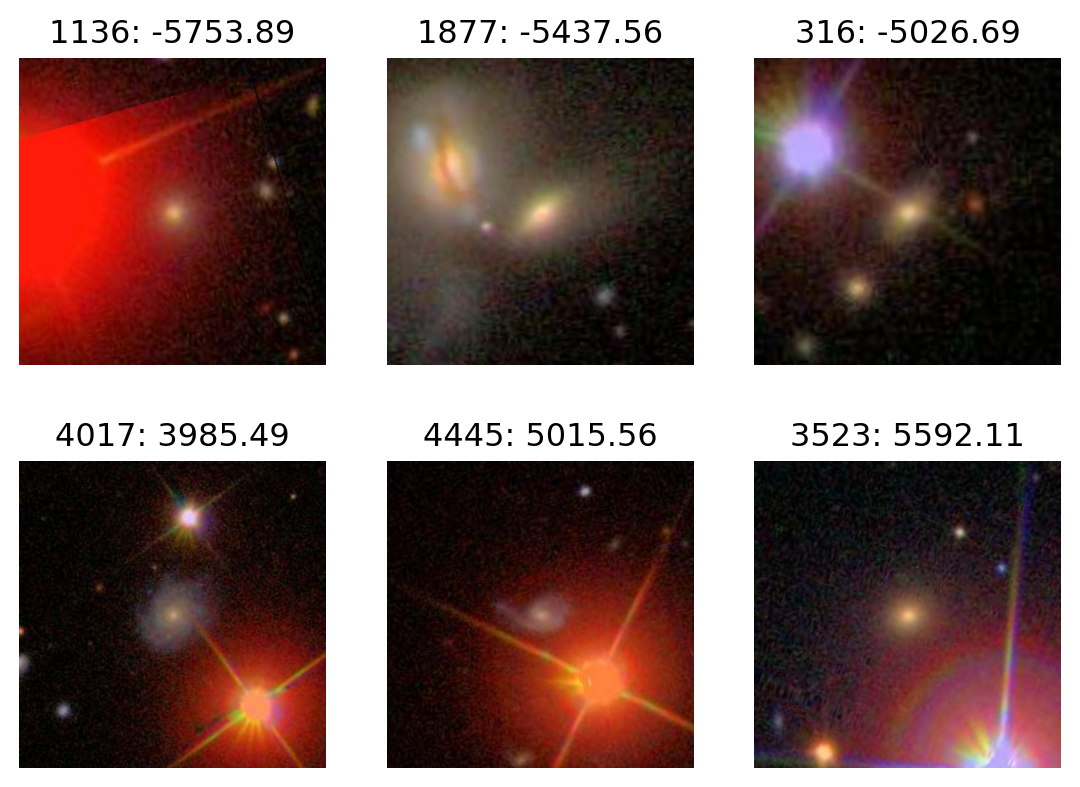
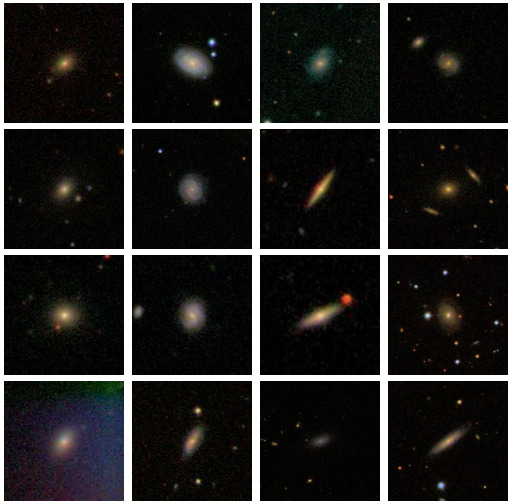
- nearly 900,000 images, each centered on a galaxy
- each 424 x 424 (color) JPEG
- I’m looking at only 5,000 of those images
- … which is 2,696,640,000 values
Goals:
- describe the color distribution among galaxies
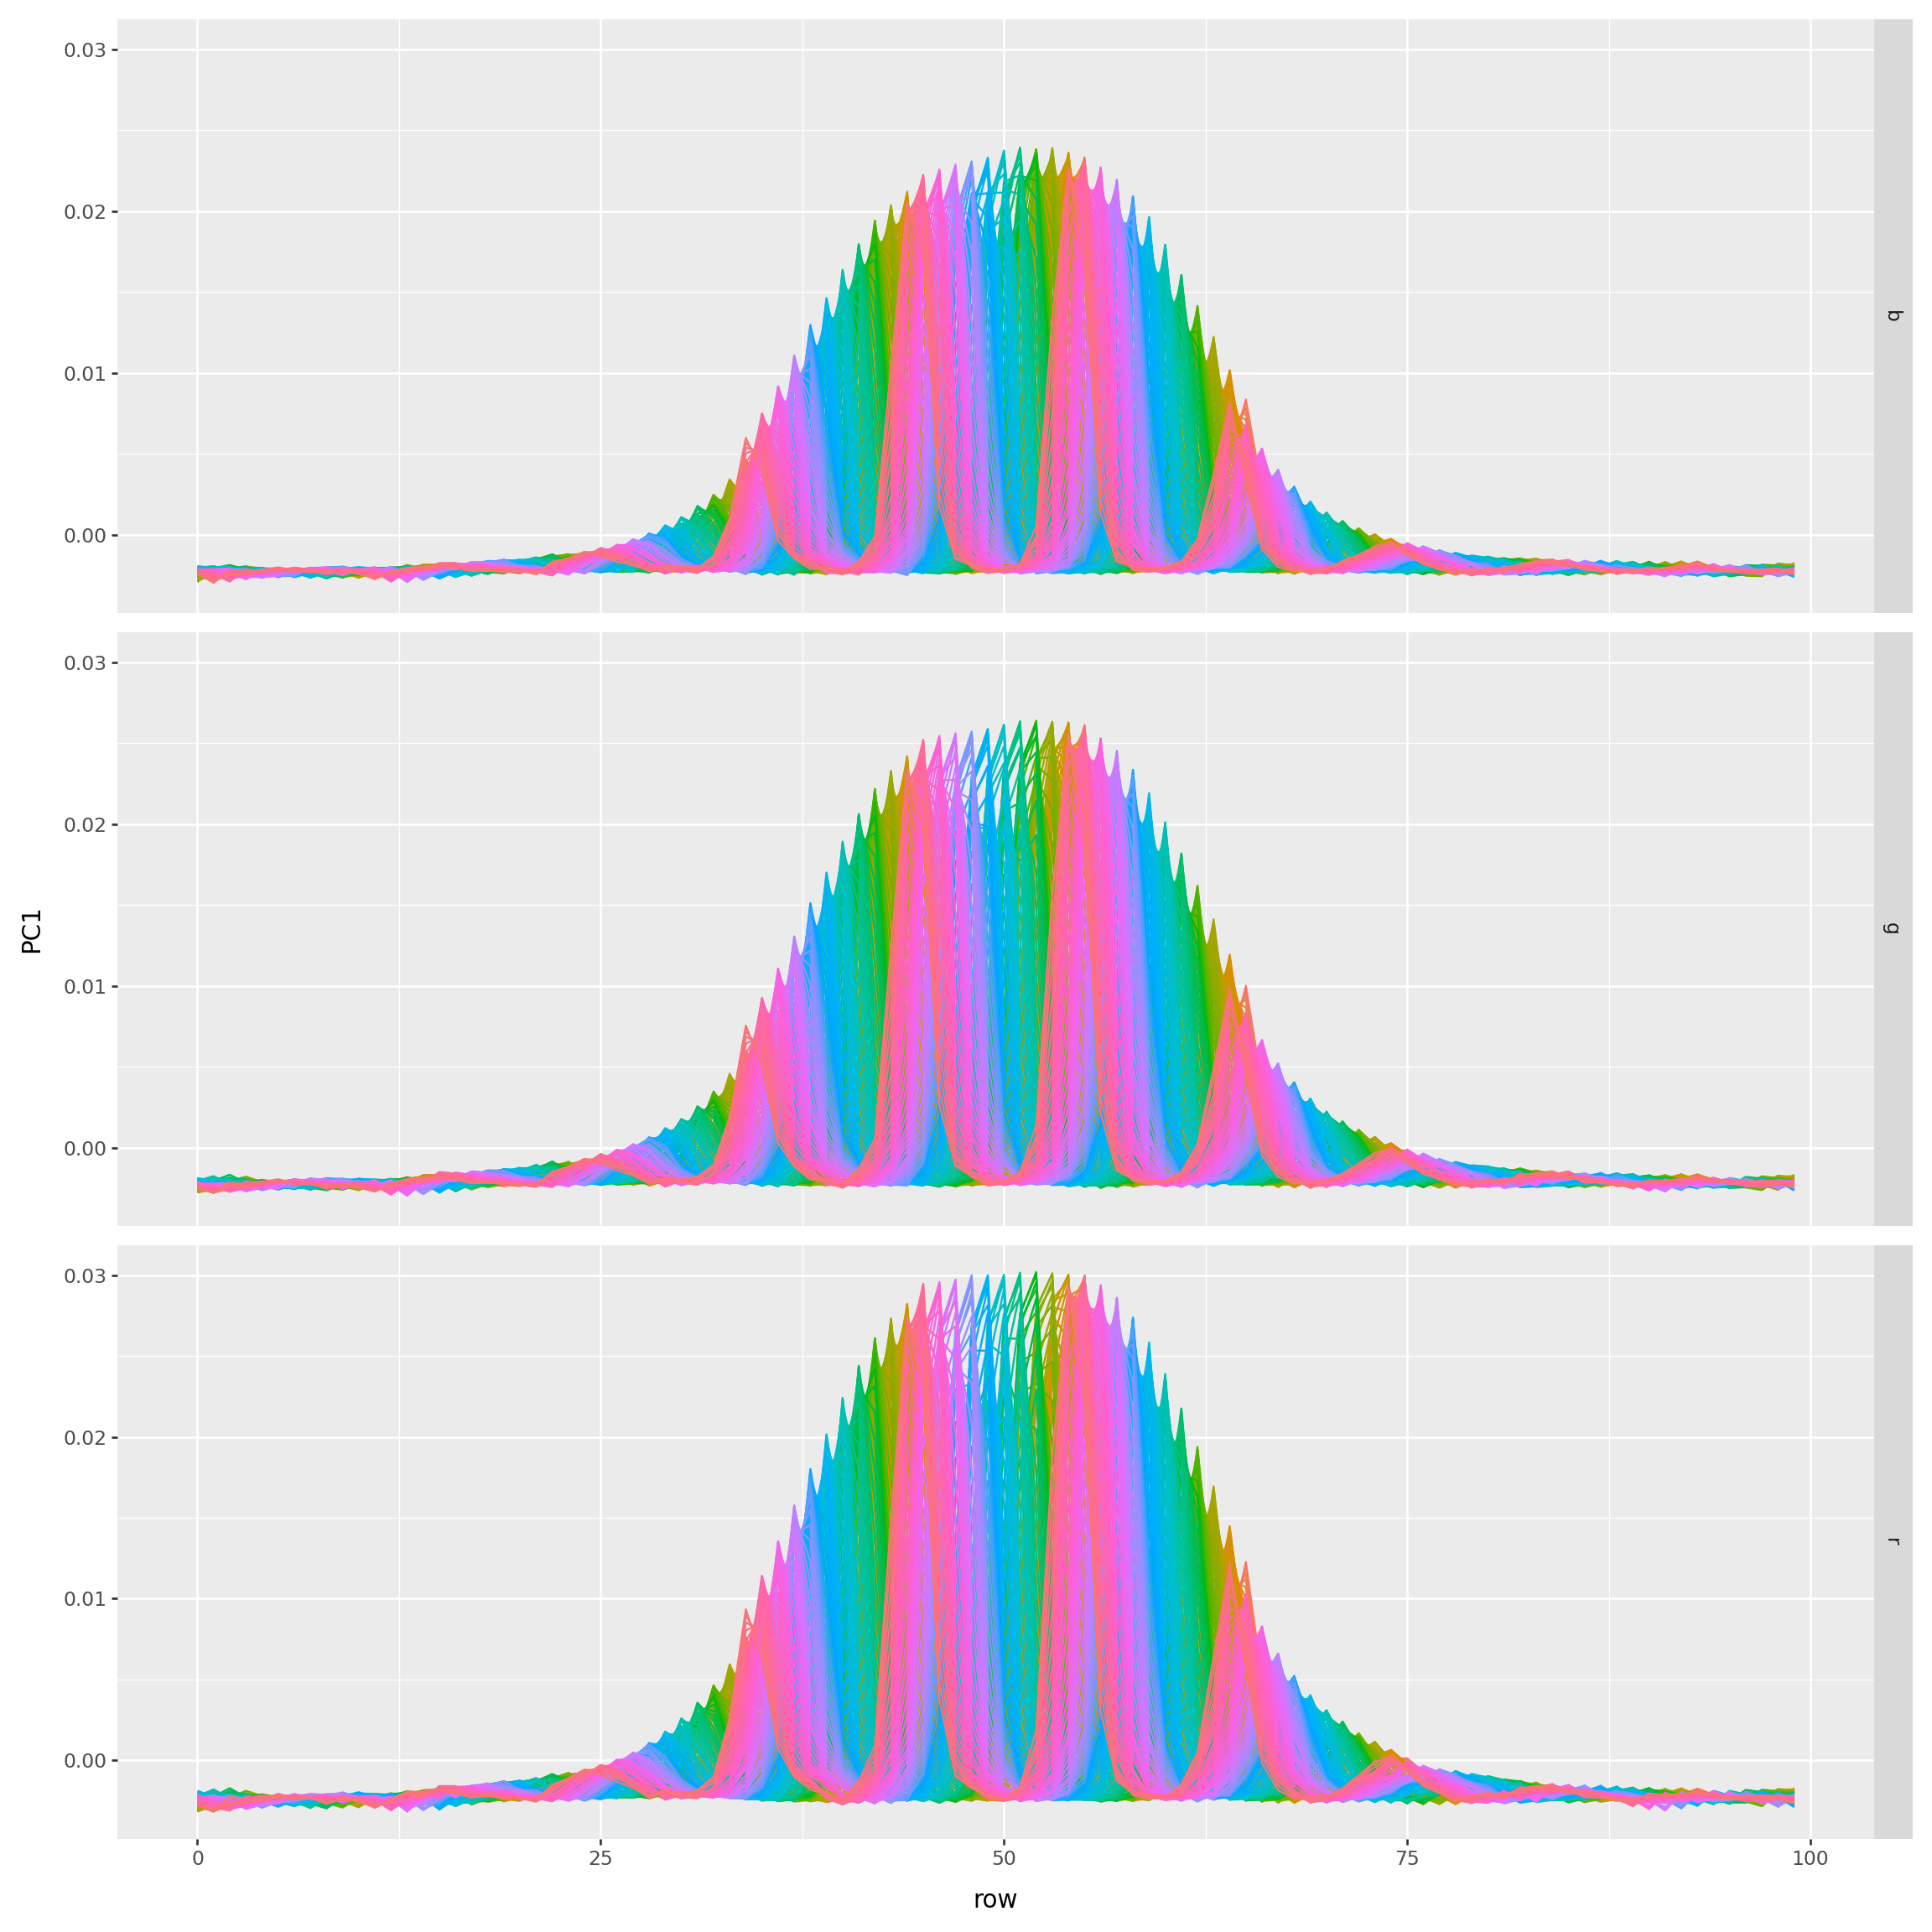
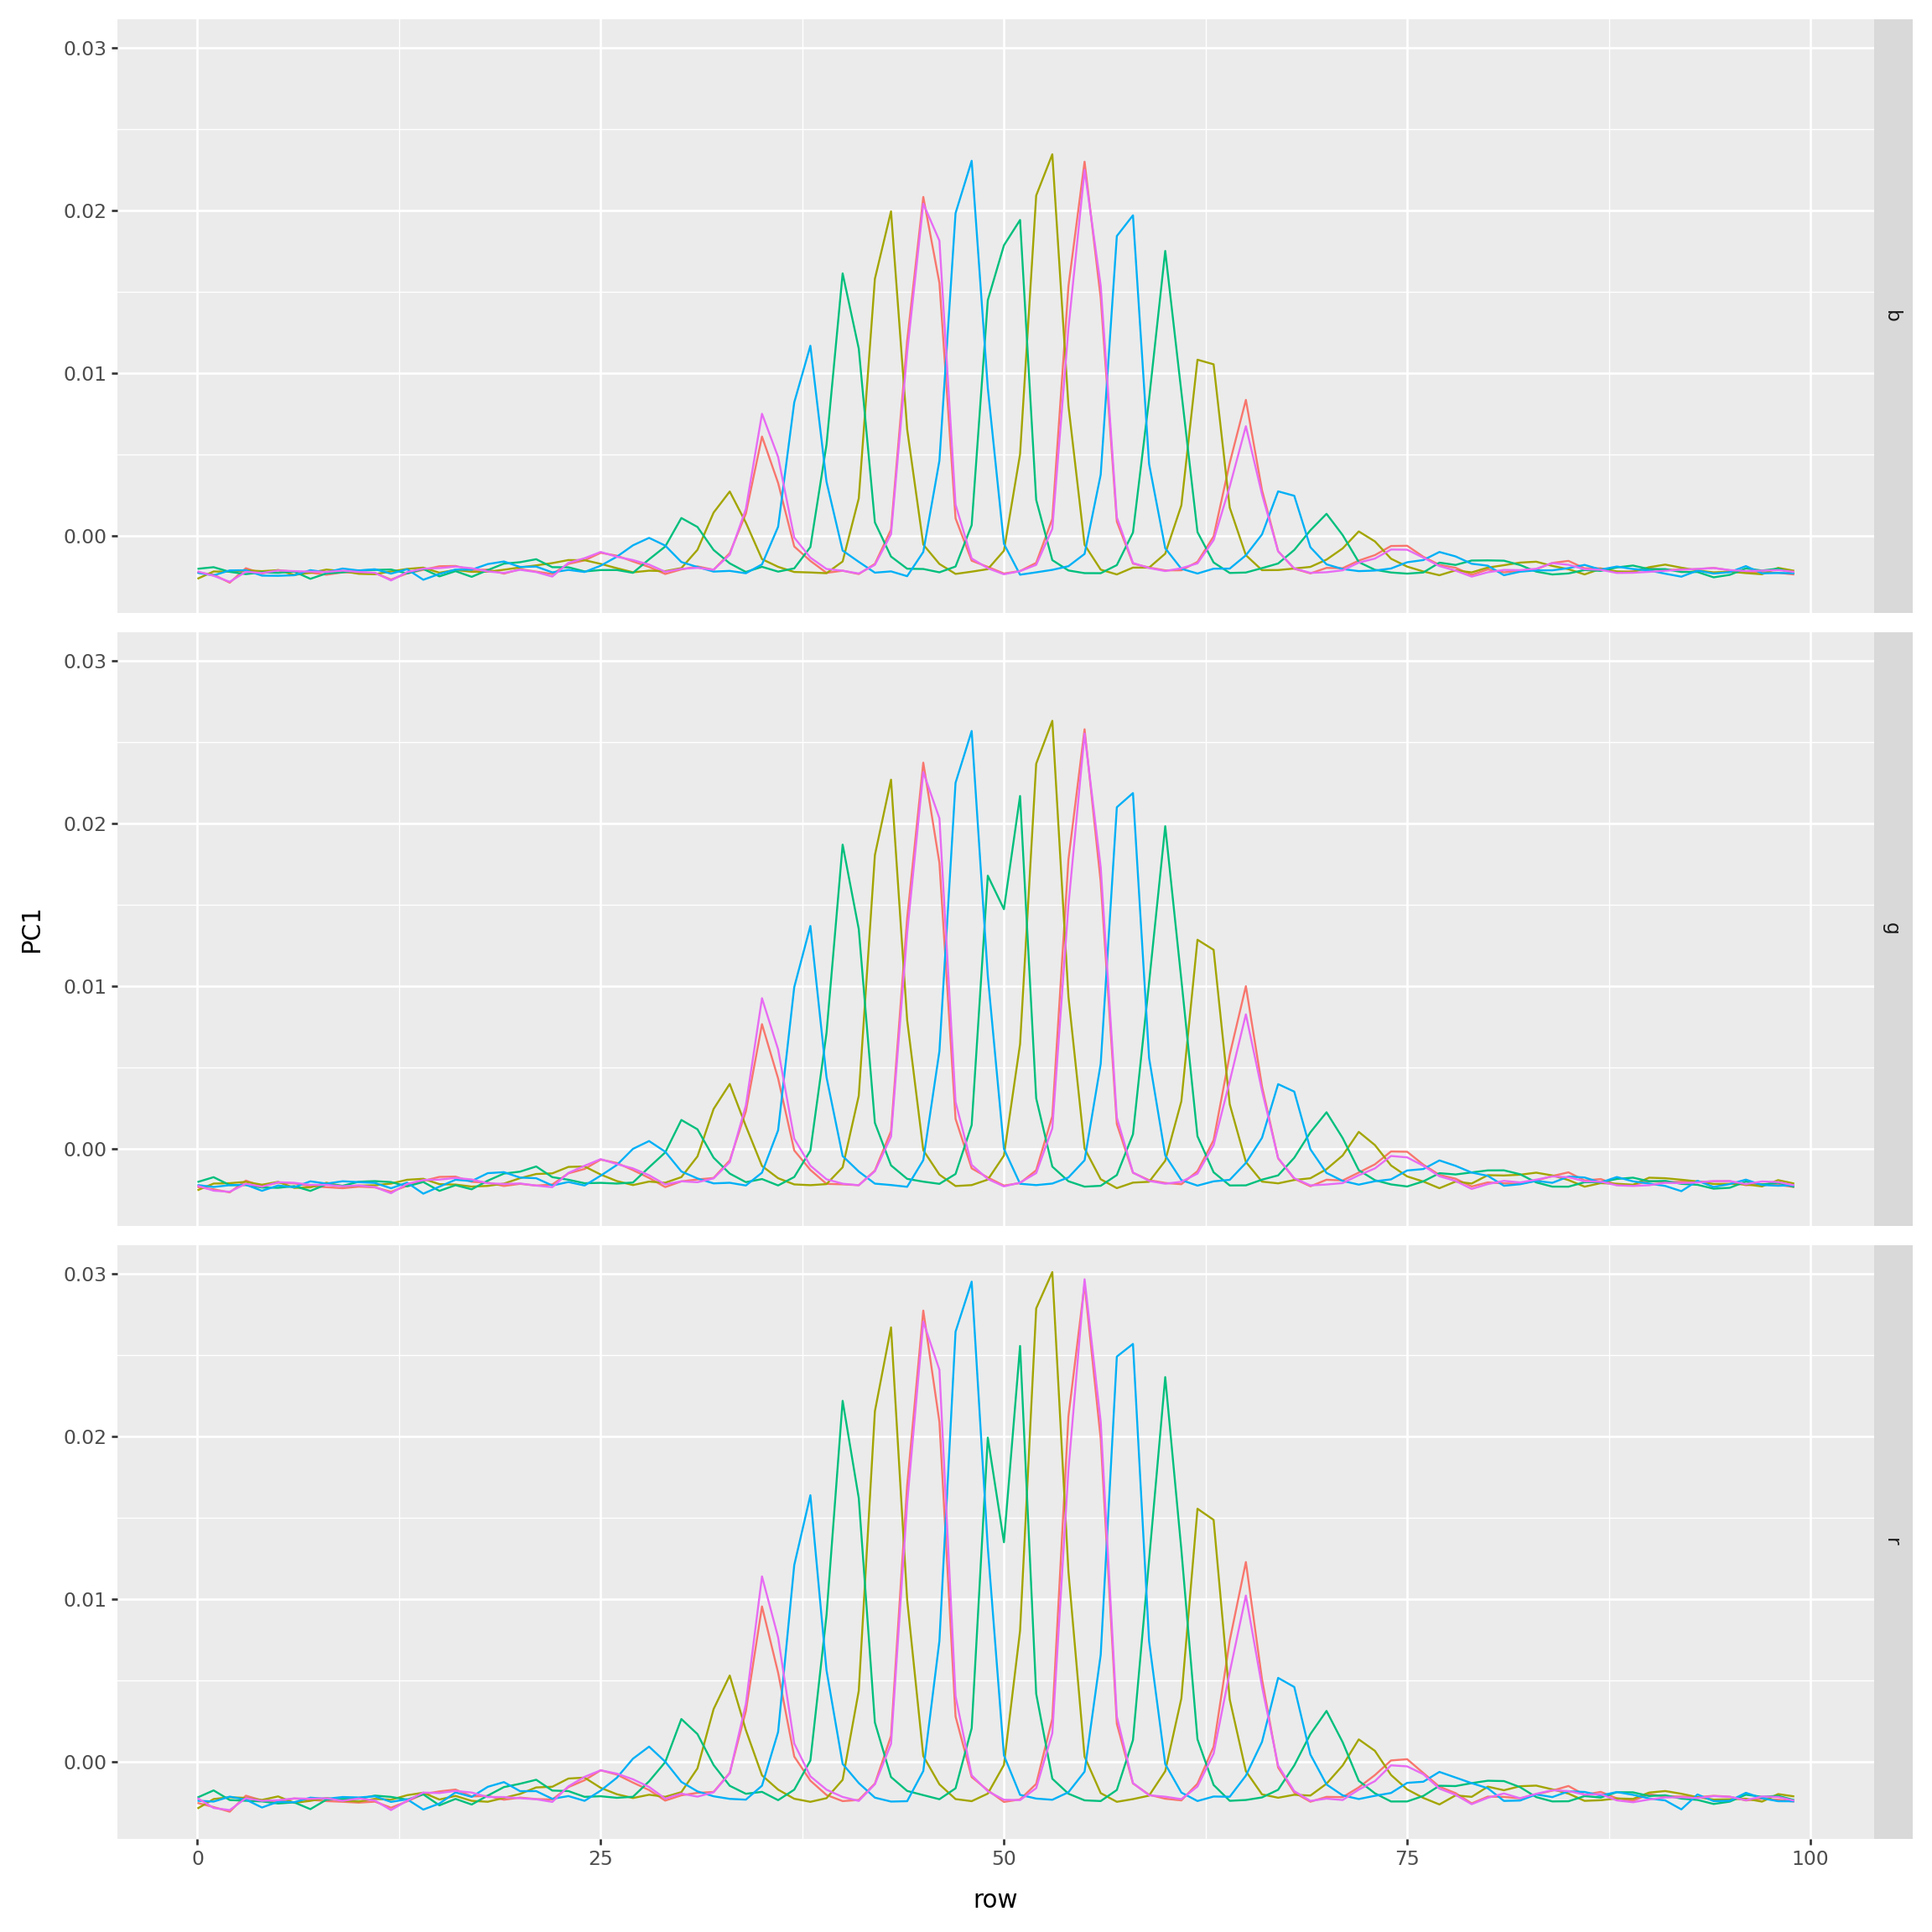
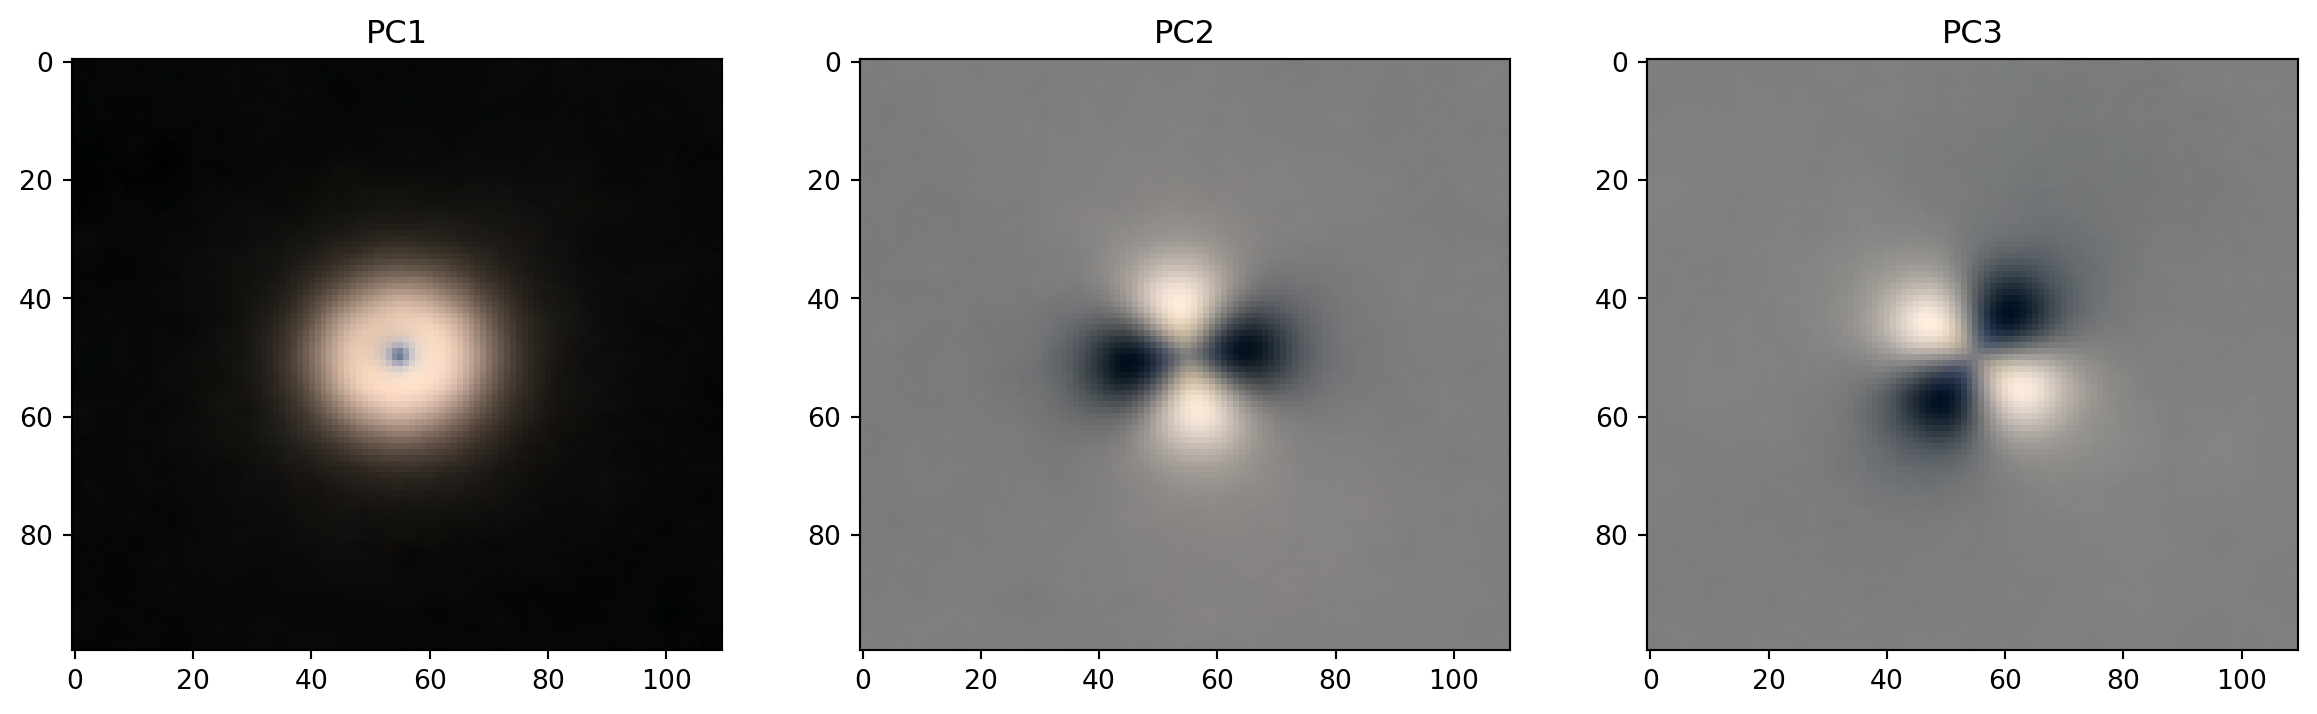
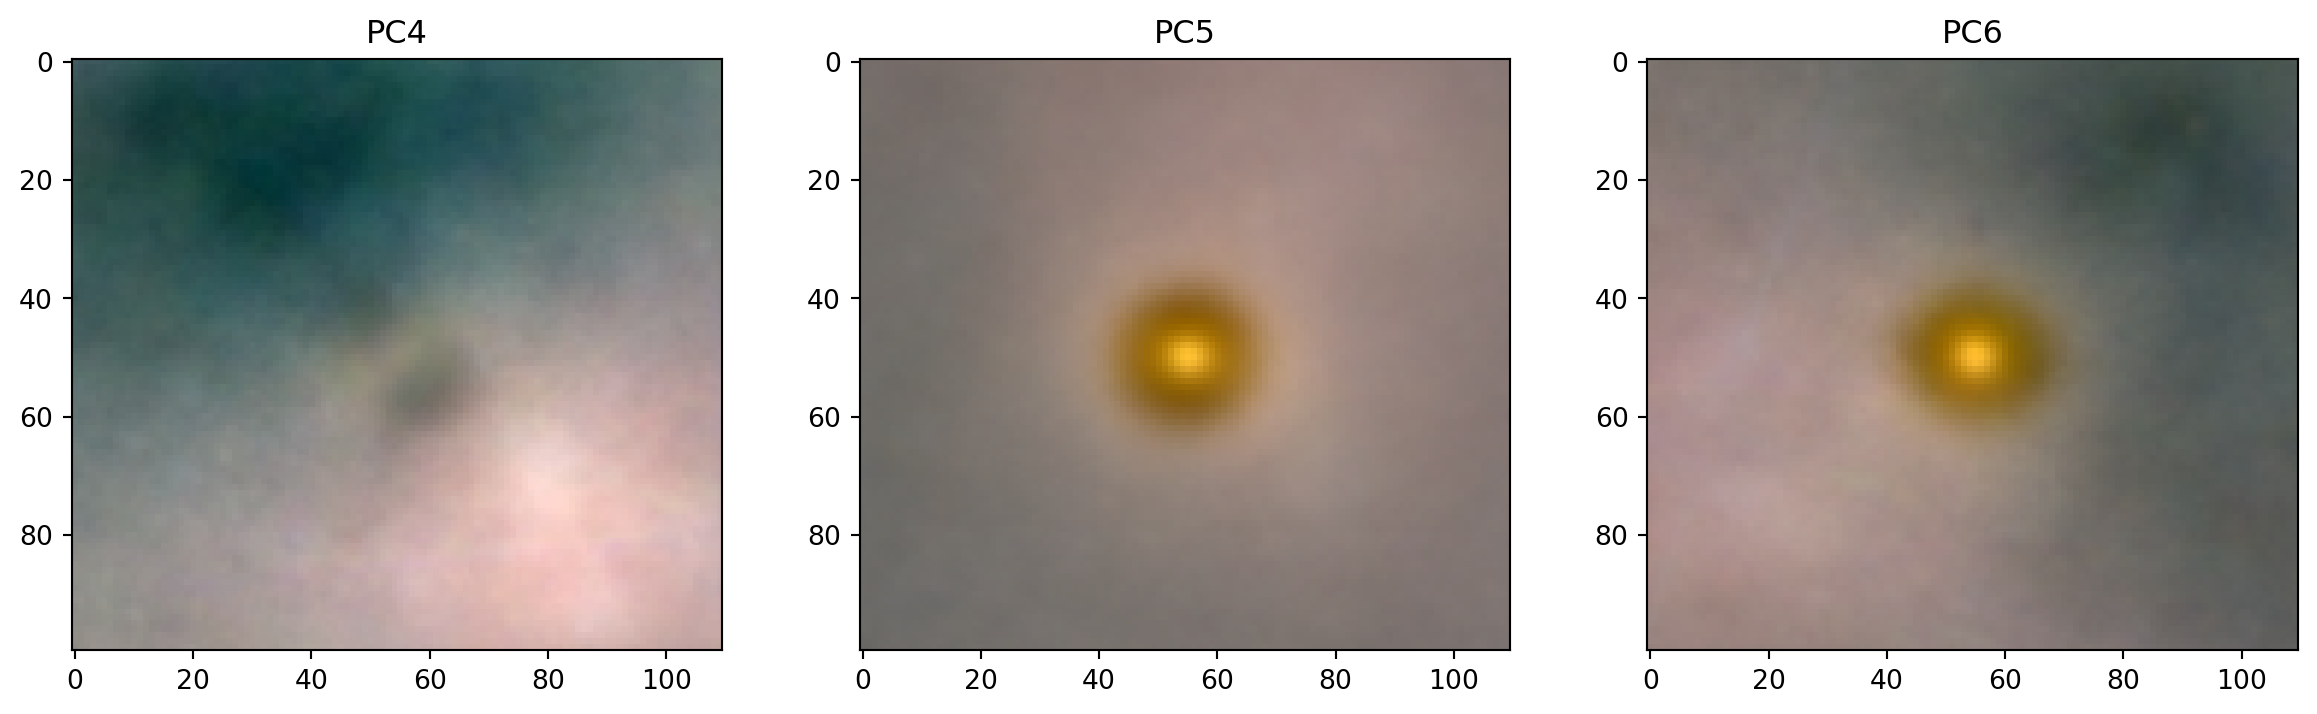
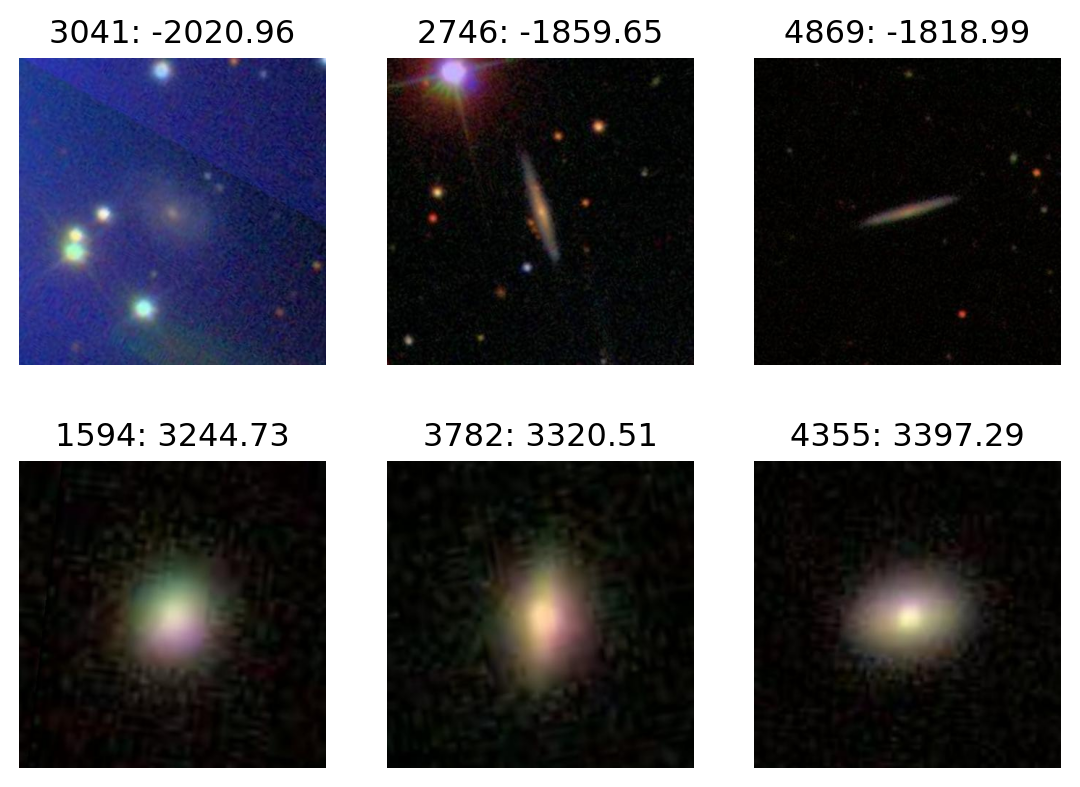
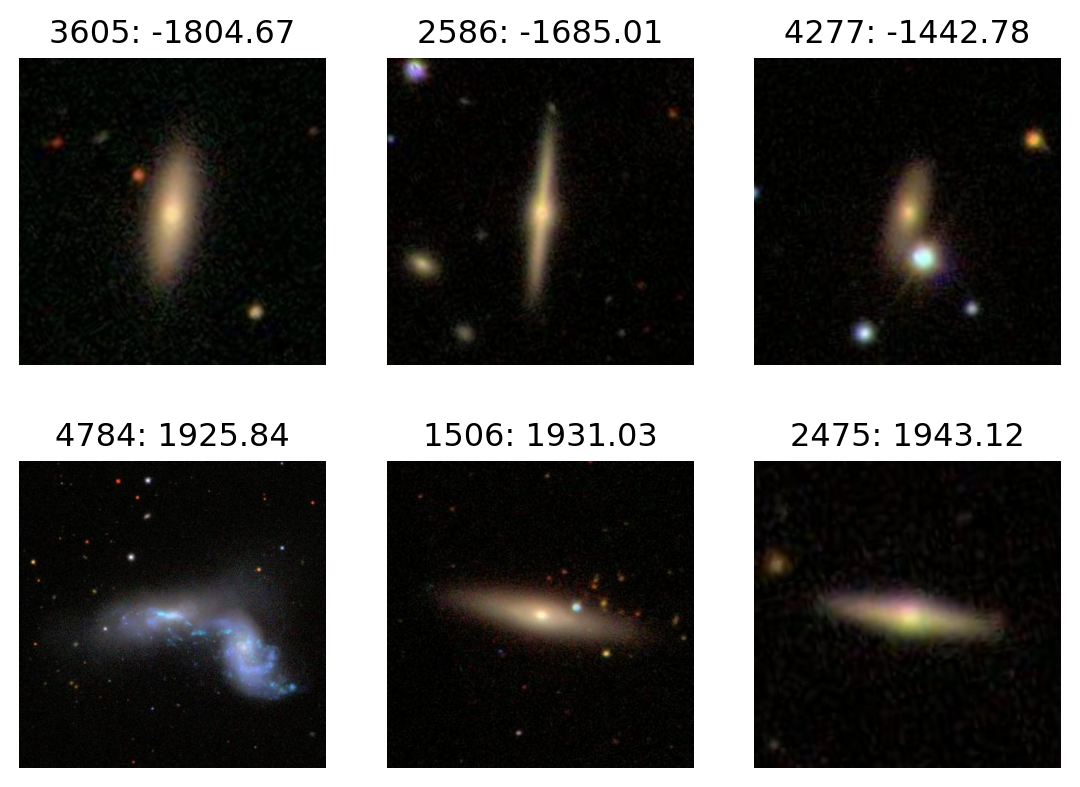
- see what PCA gives us
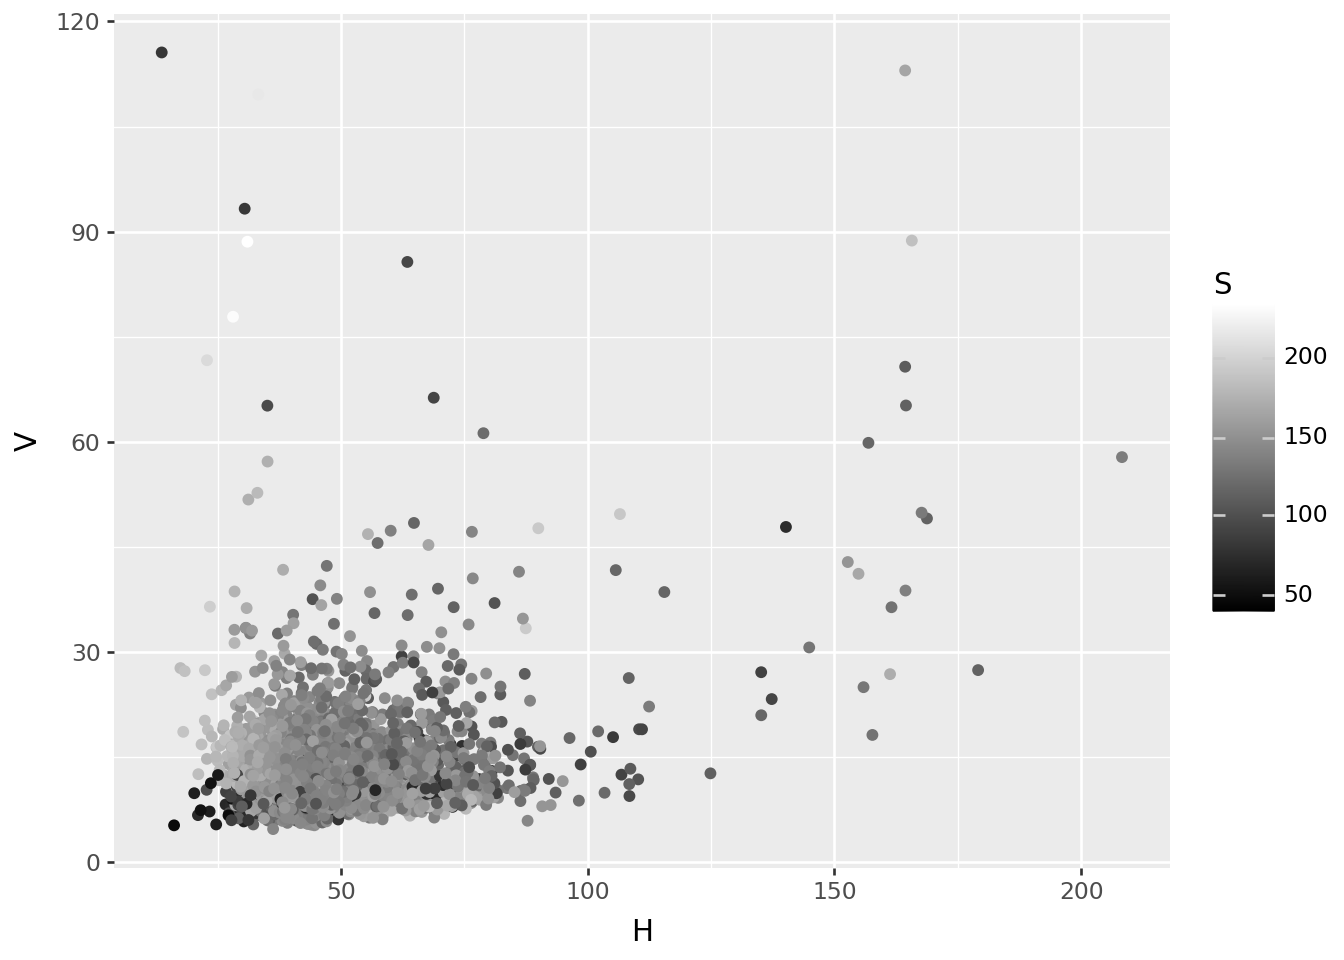
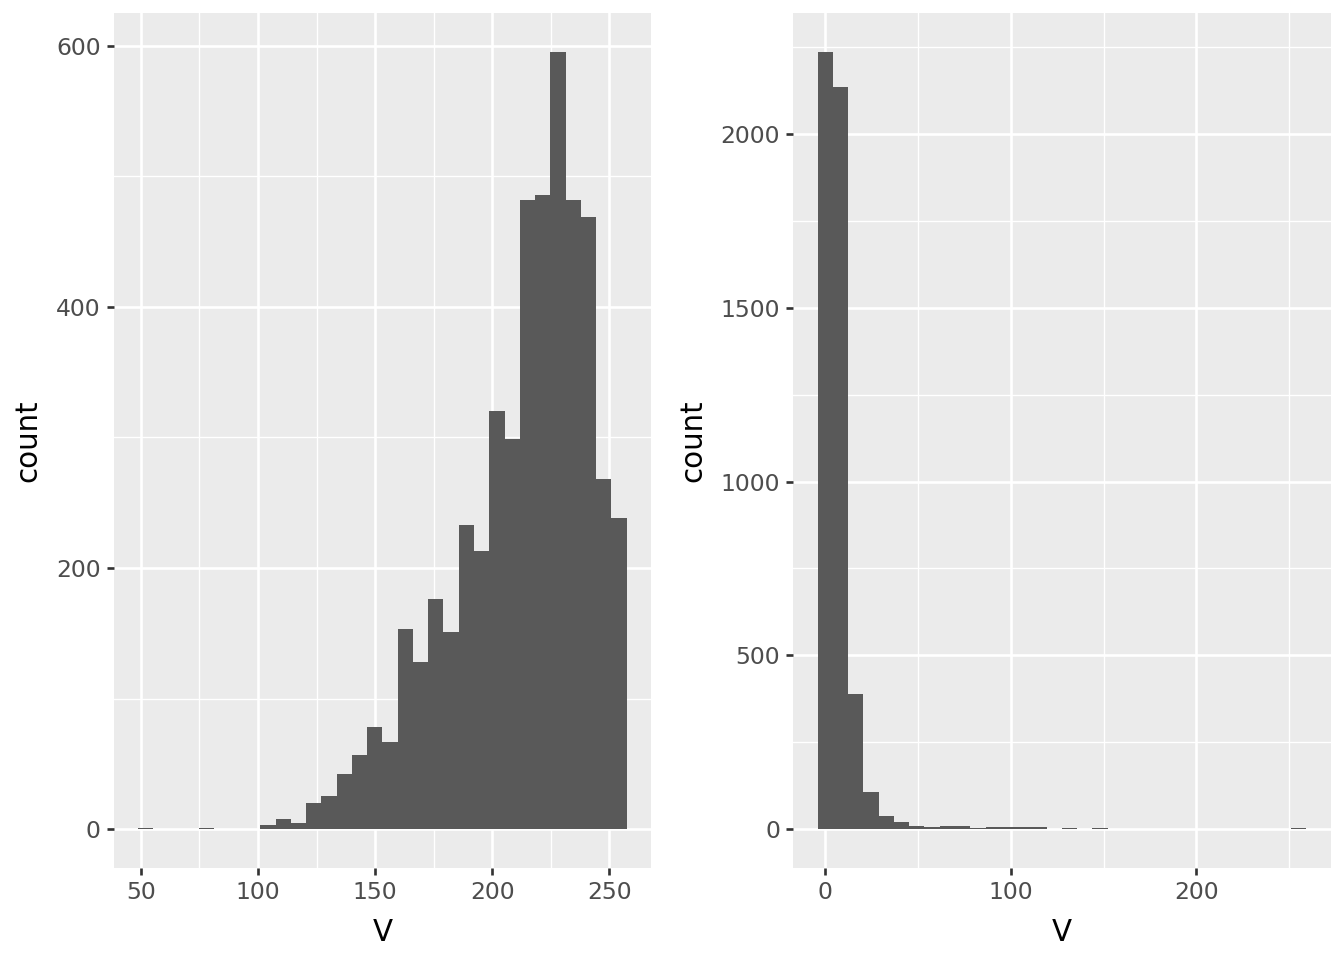
Value
Saturation
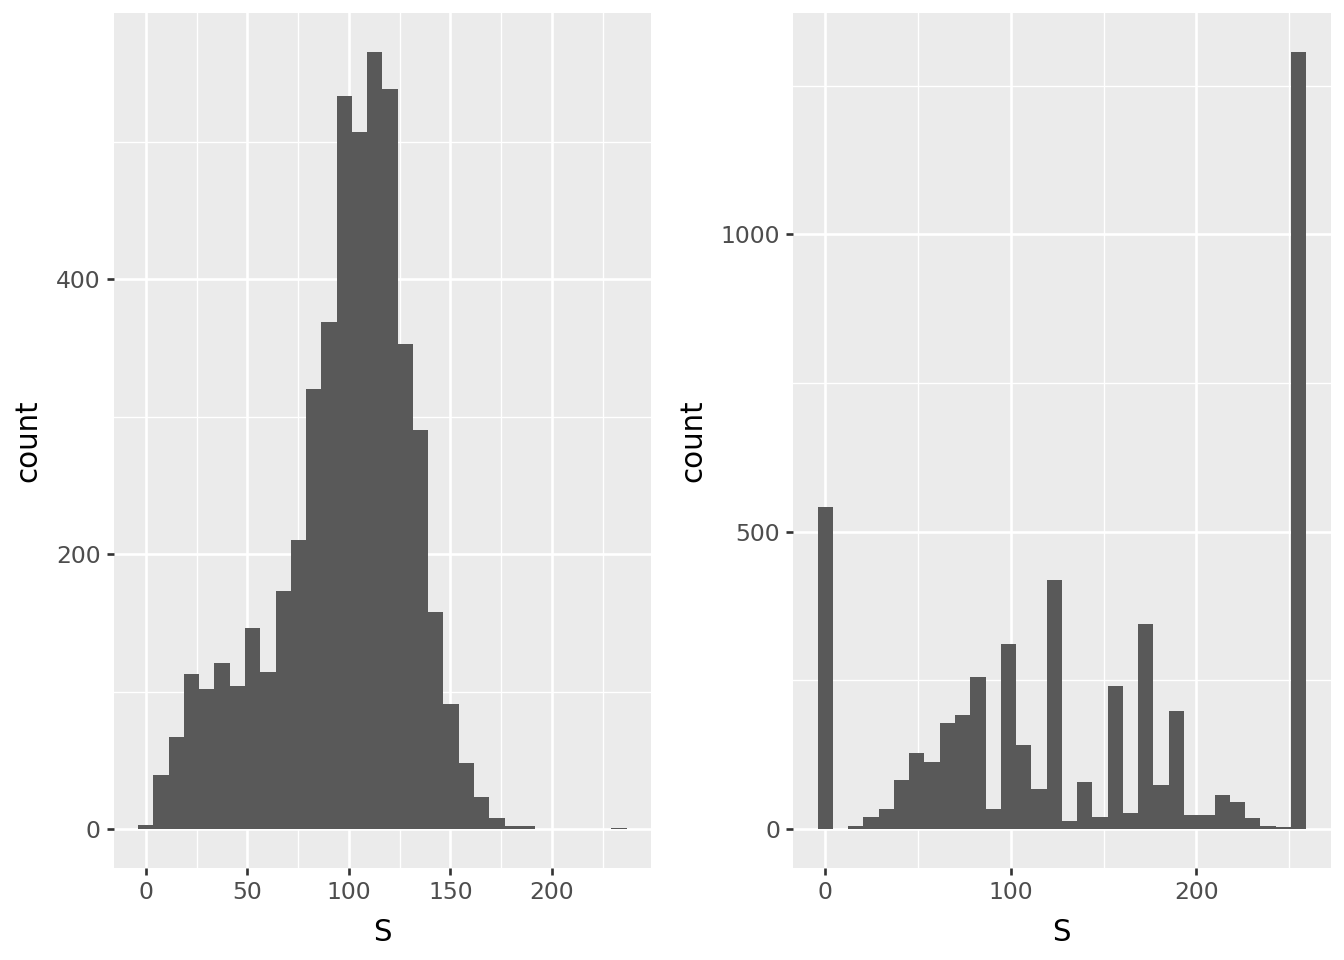
Hue
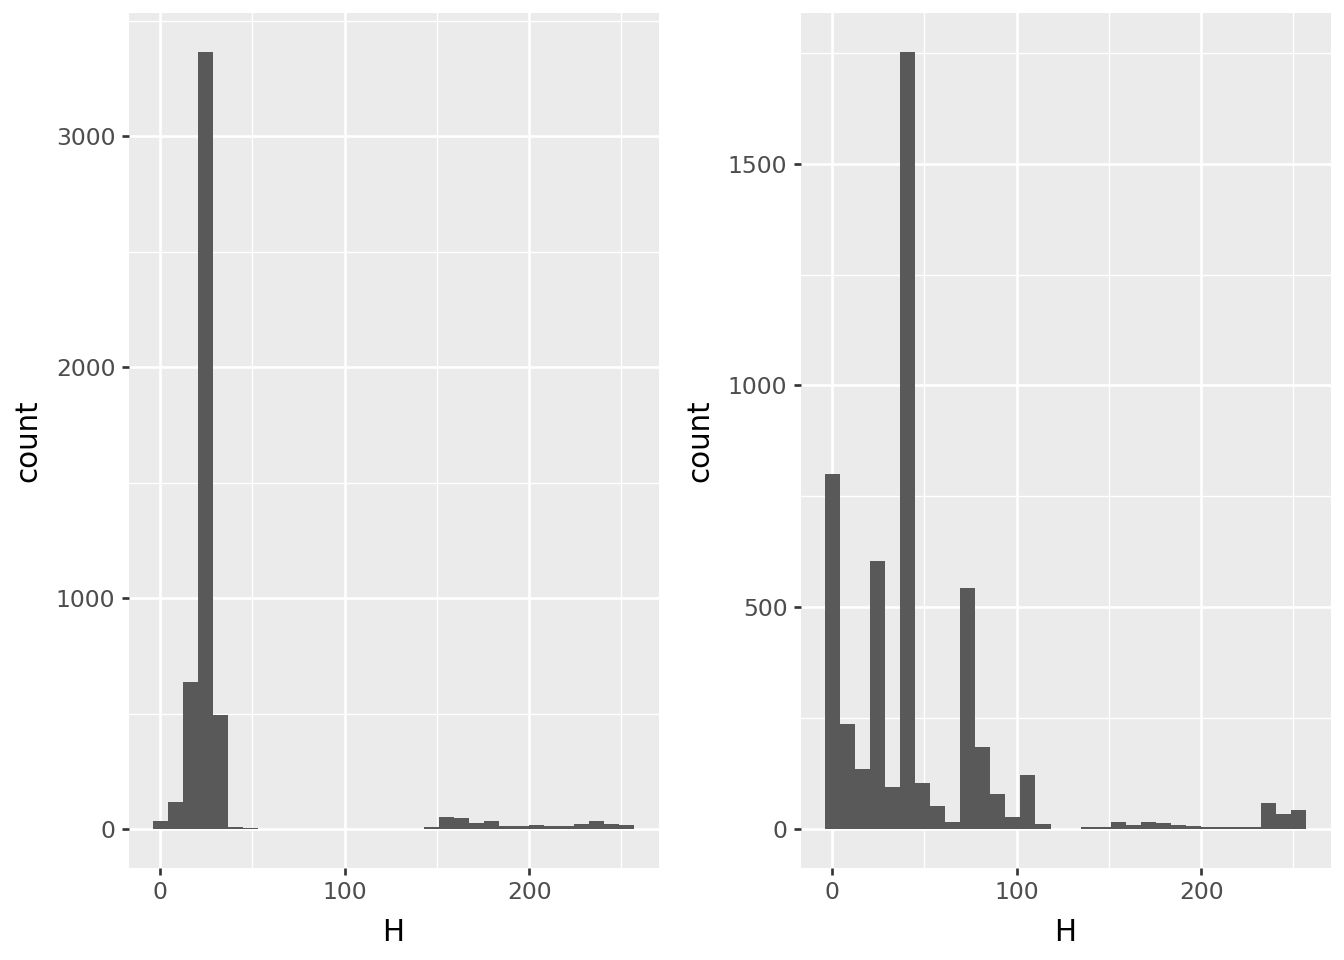
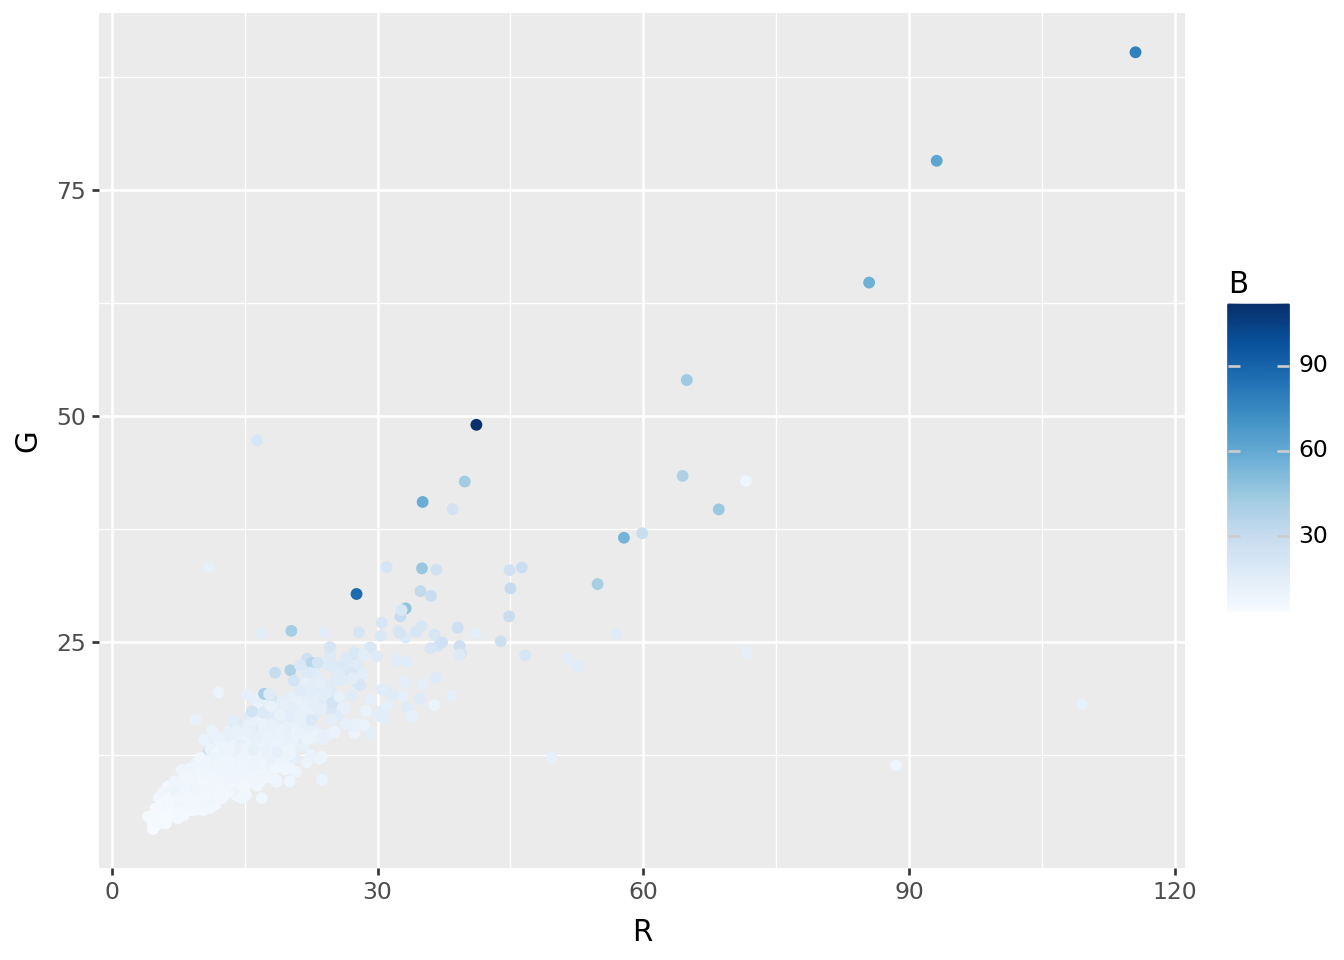
Image-wide averages
Next, the average value across the image:
RGB = pd.DataFrame(
    np.array([np.asarray(Image.open(fn)).mean(axis=(0,1)) for fn in filenames]),
    columns=("R", "G", "B"),
)
HSV = pd.DataFrame(
    np.array([np.asarray(Image.open(fn).convert("HSV")).mean(axis=(0,1)) for fn in filenames]),
    columns=("H", "S", "V"),
)
colors = pd.concat([RGB, HSV], axis=1)