Exercise: Youth Tobacco Survey
Youth Tobacco Survey
This week, you will continue with the Youth Tobacco Survey (data available here).
Here is a compiled dataset from all provided years: yts_summarized.csv, that contains the following variables for each combination of year, sex, and grade:
n: sample size (i.e., number of students in this combination of age, sex, and year)p_cig: percent of students who report having ever tried a cigarettep_vape: percent of students who report having ever tried an e-cigarettefirst_age: mean reported age at which students first smoked, of those who have reported smokingnum_days: mean number days on which smoked cigarettes of the past 30 days, of those who have reported smokingp_will_smoke: percent of students who say they will smoke a cigarette in the next yearp_harmful: percent of students who say that they think the smoke from other people’s cigarettes is harmful to them
Make exploratory plots of these data, including:
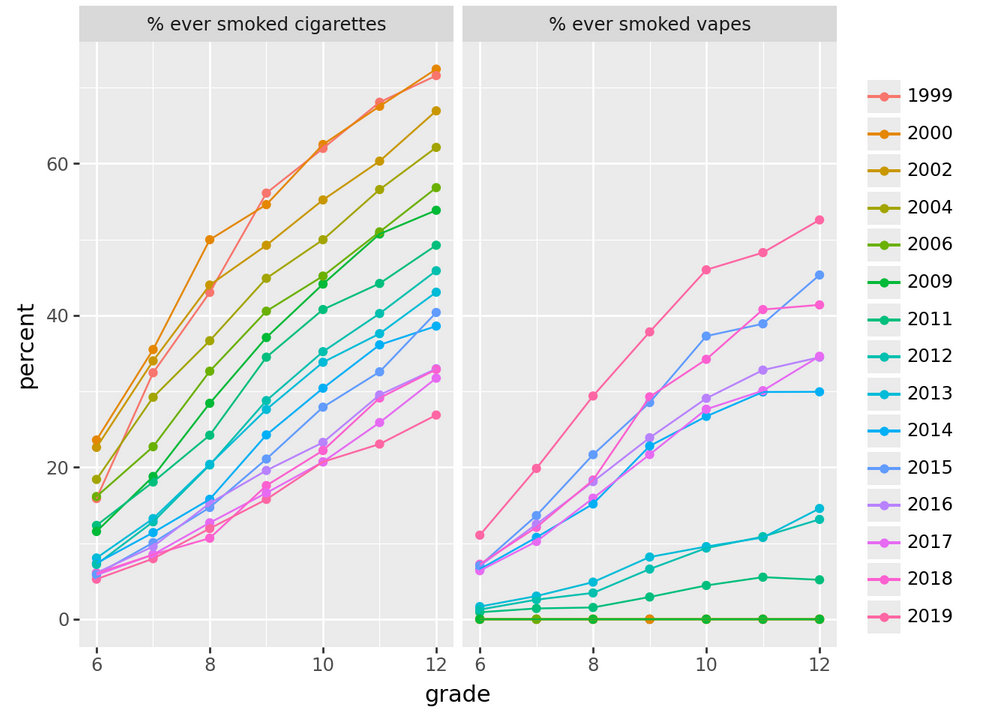
- the percent of eigth-graders who report having tried a cigarette, across time, by reported sex
- the same thing, for vapes
- the mean reported age at which students first smoked in 2006, plotted against grade, with separate lines by sex
- the mean reported age at which students first smoked in 2006, plotted against grade, with separate lines by year and facets by sex
- the percentage who think they’ll smoke in the next year against the percentage who think second-hand smoke is harmful, with one line per grade, and facets by sex
Challenge: Make this plot